Introduction to GIS for Urban Planning
Assignments


Final Project
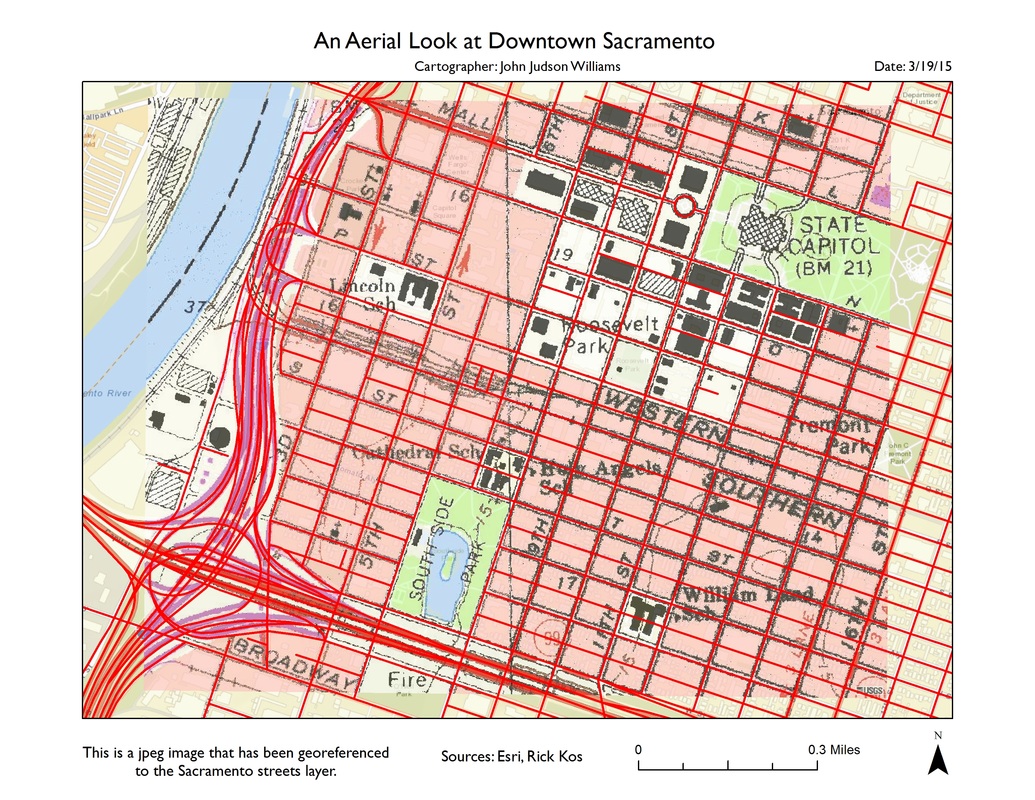
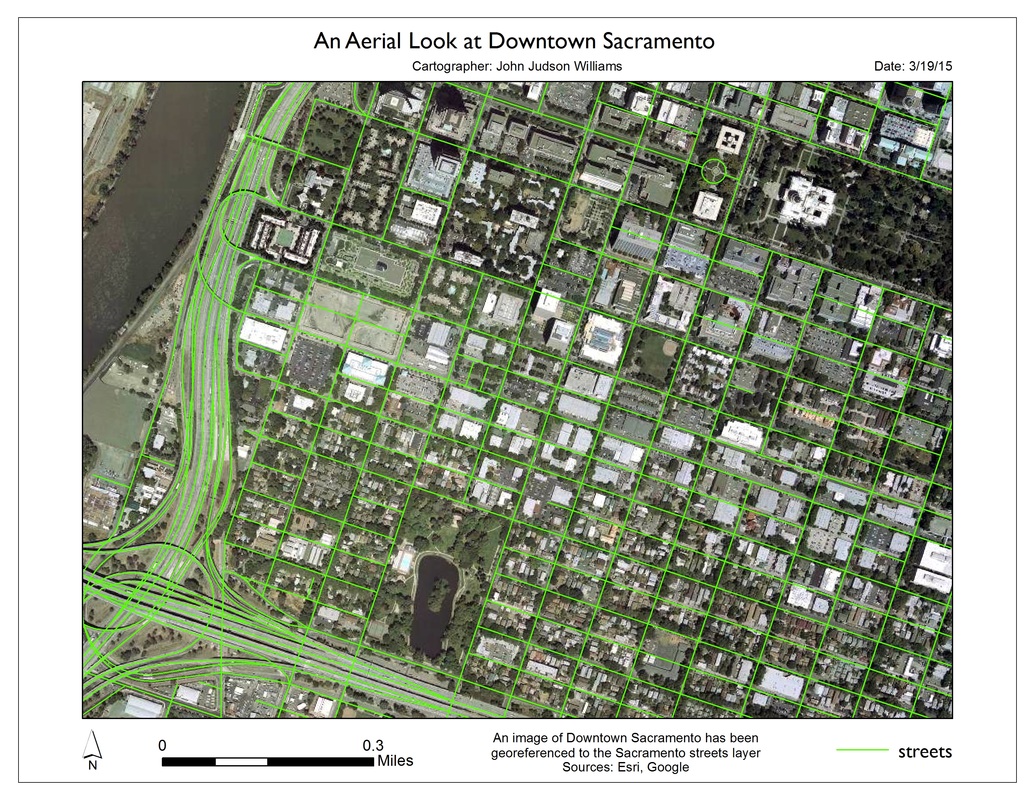
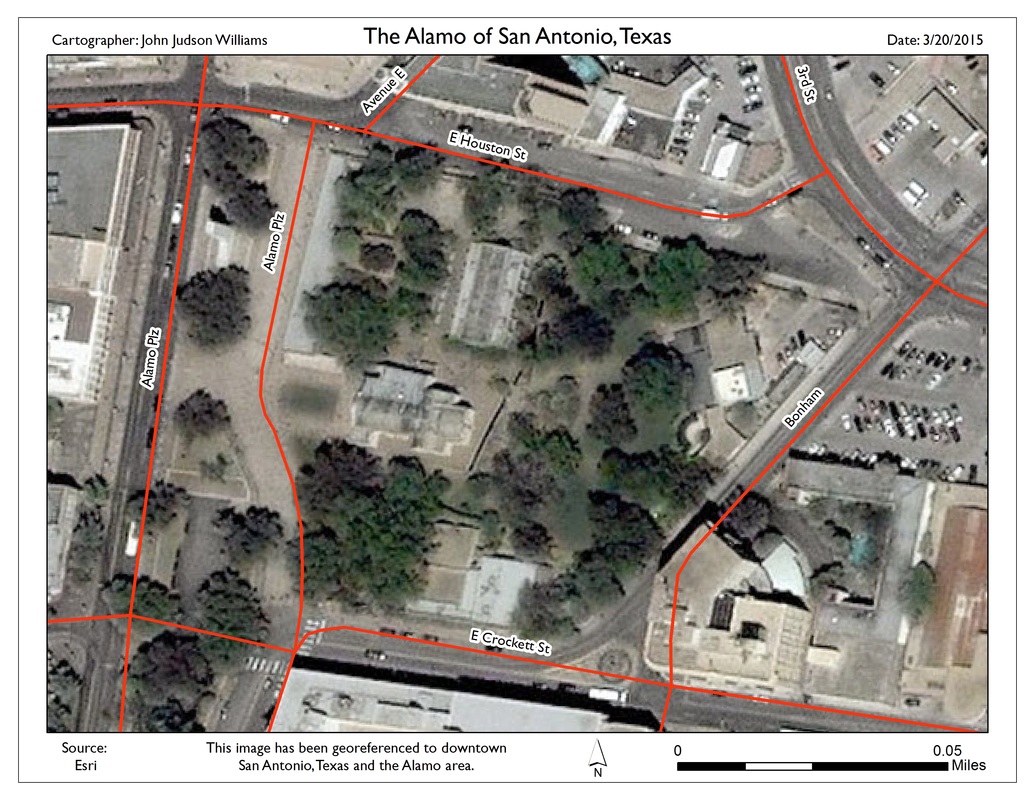
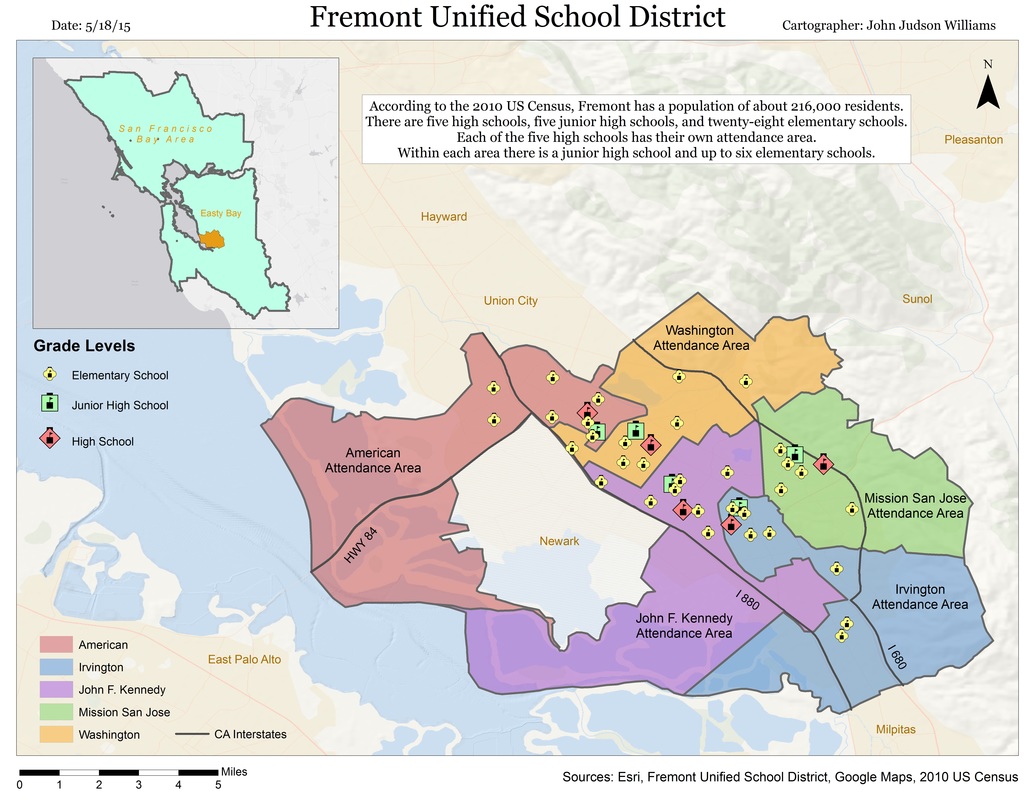
The overall objective of this project was to combine the use of GIS skills learned throughout the semester by creating new map. Some of the GIS skills used to create this map included: geocoding, georeferencing, geoprocessing, and definition queries. According to the 2010 US Census, Fremont has a population of about 216,000 residents. There are five high schools, five junior high schools, and twenty-eight elementary schools. Each of the five high schools has their own attendance area. Within each attendance area there is a junior high school and up to six elementary schools.
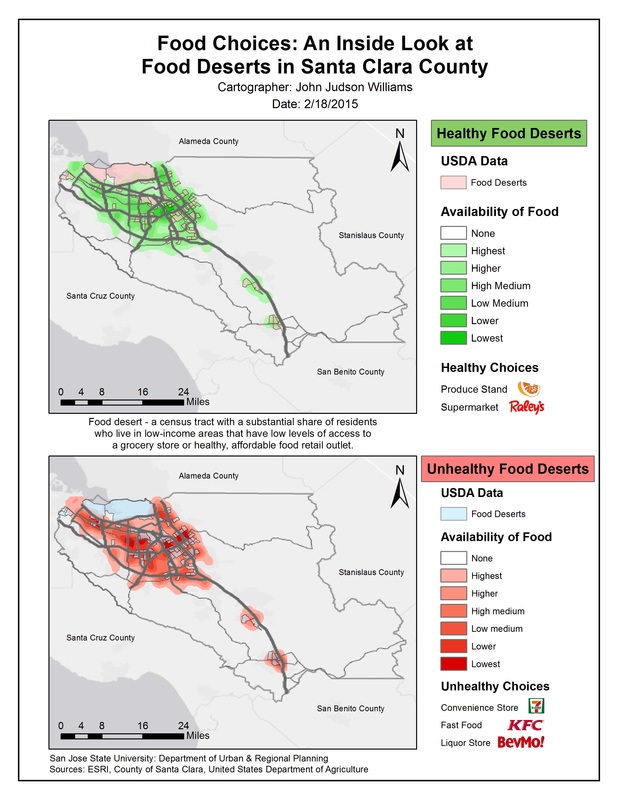
Food Choices: A Look at Food Deserts in Santa Clara County
These series of maps show food desert locations throughout Santa Clara County.
The United States Department of Agriculture (USDA), United States Treasury, and Health and Human Services (HHS) have defined a food desert as, "a census tract with a substantial share of residents who live in low-income areas that have low levels of access to a grocery store or healthy, affordable food retail outlet."
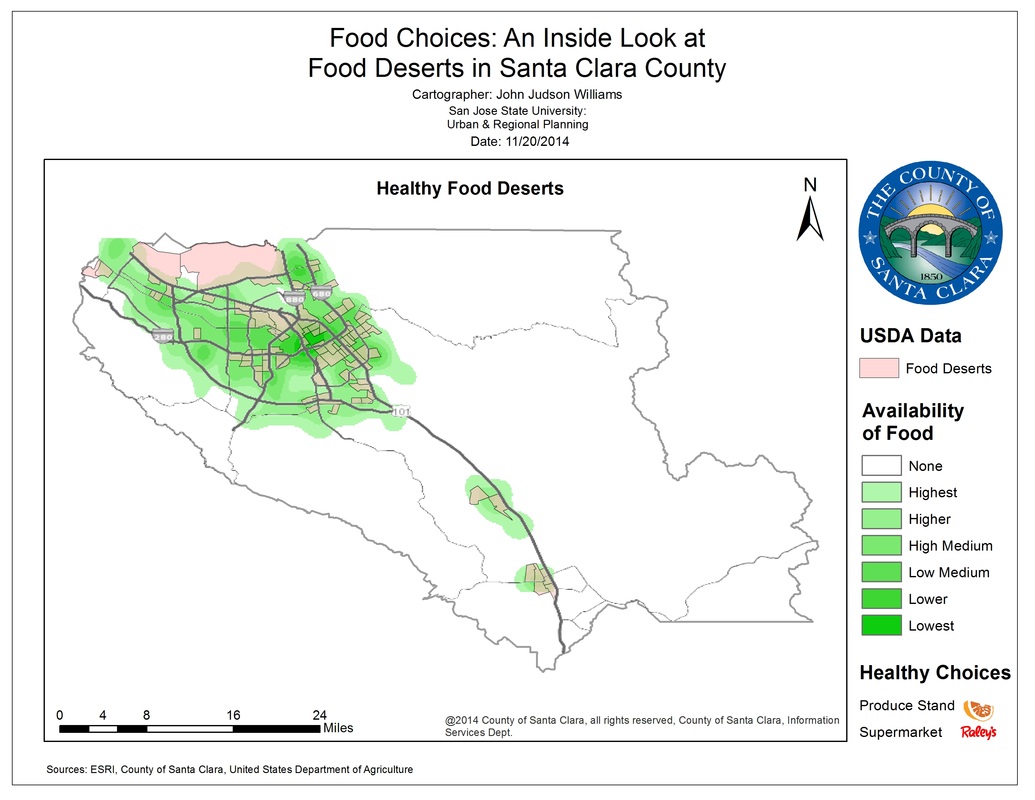
The green heat maps shows food deserts between healthy businesses. Healthy businesses include produce stands and supermarkets.
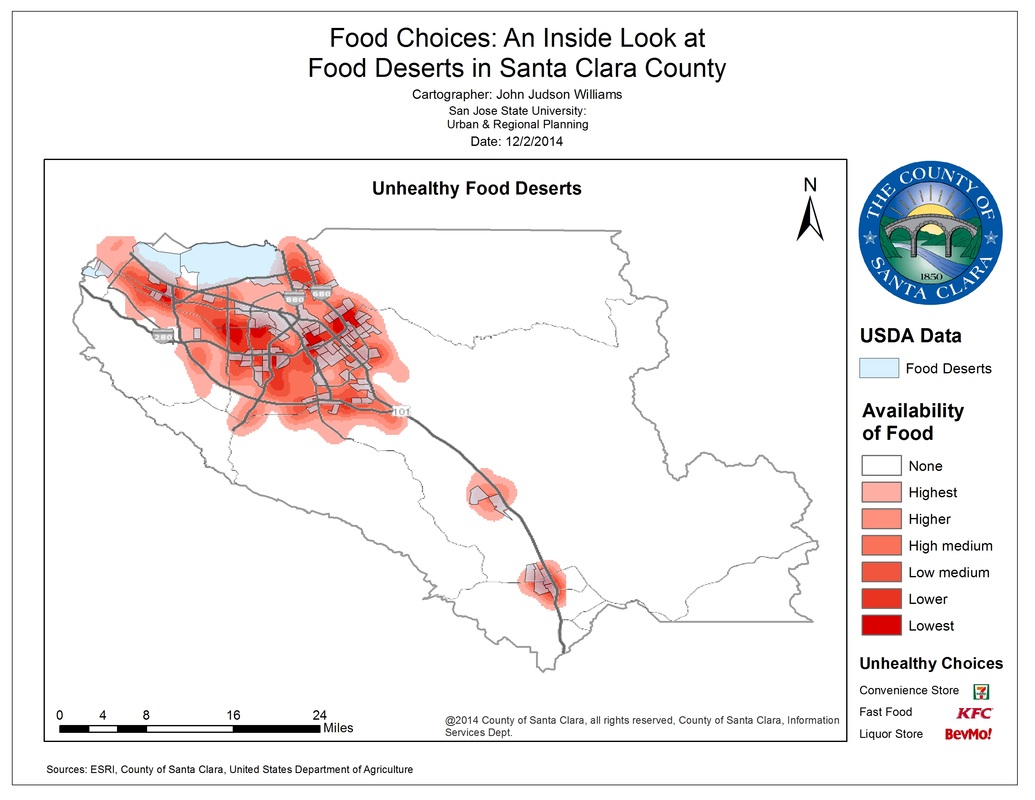
The red heat maps shows food deserts between unhealthy businesses. Unhealthy businesses include convenience stores, fast food restaurants, and liquor stores.
A majority of the population is located in the northwest section of the county. Although the food deserts in Morgan Hill and Gilroy region are not as predominate, they are still part of the growing problem.
If you have any questions about this map, feel free to message me. I will be happy to answer them.
The United States Department of Agriculture (USDA), United States Treasury, and Health and Human Services (HHS) have defined a food desert as, "a census tract with a substantial share of residents who live in low-income areas that have low levels of access to a grocery store or healthy, affordable food retail outlet."
The green heat maps shows food deserts between healthy businesses. Healthy businesses include produce stands and supermarkets.
The red heat maps shows food deserts between unhealthy businesses. Unhealthy businesses include convenience stores, fast food restaurants, and liquor stores.
A majority of the population is located in the northwest section of the county. Although the food deserts in Morgan Hill and Gilroy region are not as predominate, they are still part of the growing problem.
If you have any questions about this map, feel free to message me. I will be happy to answer them.
Cartographer - John J Williams